

International Comparisons with a PPP Metric
If you are someone from a high-income country, or even just a high-income city, and you travel to other places, you are familiar with finding that, at least sometimes, many items are considerably cheaper in the low-income country: food and meals, entertainment and even health care.
As a result, $100 of buying power in the US economy seems to buy more goods and services in a number of other places around the world.
The World Bank International Comparison Program attempts to do an adjustment for prices around the world: that is, what would it cost to buy the same “basket of goods” (as economists say) in different countries. The result of this adjustment is to calculate a difference between the “market exchange rate” and the “purchasing power parity or PPP exchange rate. The market exchange rate tells you how much of one currency you receive in exchange for another. The PPP exchange rate adjusts for what goods and services that currency can actually buy. The PPP exchange rate adjusts for what that goods and services that currency can actually buy. Doing these “purchasing power parity” comparisons is a huge task, and so the ICP only updates the PPP numbers every few years. The 2021 comparison is now available.
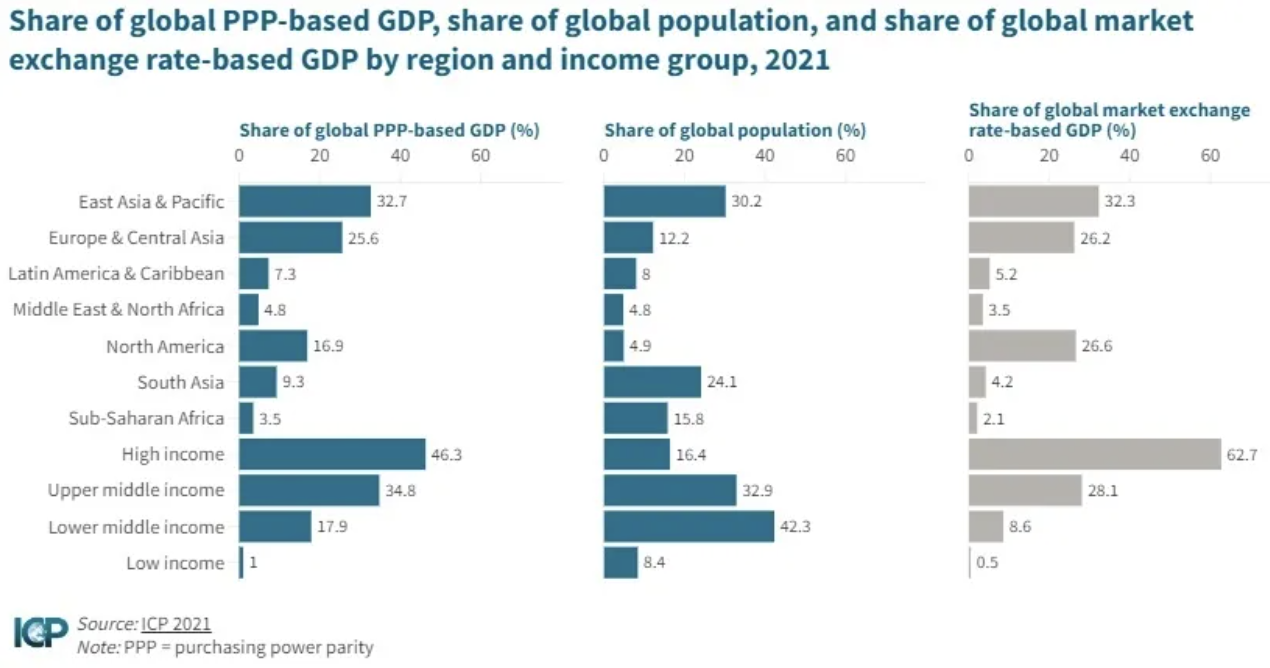
When comparing the size of national or regional economies, a standard result is that the economies of high-income countries look relatively smaller when measured in PPP terms than when measured in market exchange rates, because prices tend to be lower in the low-income countries. For example, the third panel of this figure shows that the high-income countries are 62% of global GDP if measured in market exchange rates, but 46% of world GDP measured in “what you can buy with it” PPP exchange rates.
Using PPP exchange rates to compare the sizes of economies means that China is already the largest economy in the world. The ICP report notes:
The largest economy in the world in 2021 was China, recording a PPP-based GDP of $28.8 trillion, reflecting 18.9 percent of the global GDP. The United States was the second largest, with nearly $23.6 trillion or 15.5 percent of the global GDP. India’s economy was the third largest at $11.0 trillion, accounting for 7.2 percent. Also in the ten largest economies group were the Russian Federation ($5.7 trillion and 3.8 percent), Japan ($5.6 trillion and 3.7 percent), Germany ($5.2 trillion and 3.4 percent), Brazil ($3.7 trillion and 2.4 percent), France ($3.6 trillion and 2.4 percent), the United Kingdom ($3.5 trillion and 2.3 percent), and Indonesia ($3.5 trillion and 2.3 percent).
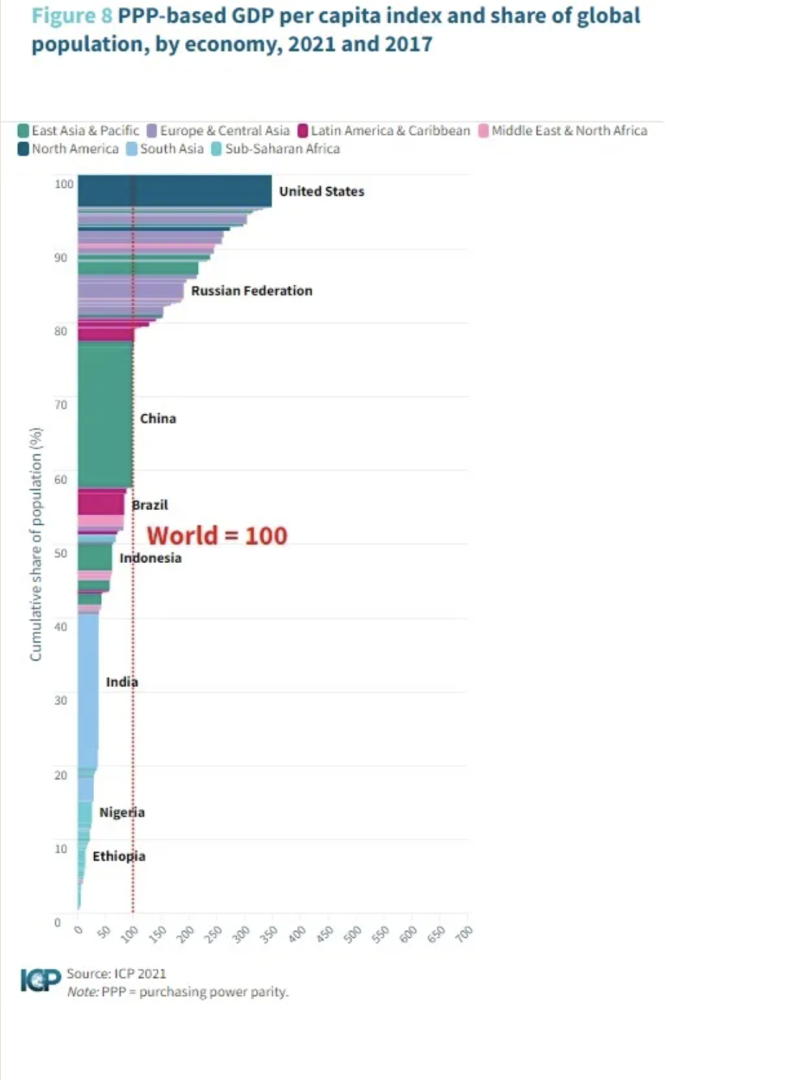
Here’s a snapshot of the world economy through a PPP lens. The vertical axis shows the share of global population for each country (thus, China and India are the largest), while the horizontal axis shows per capita GDP as measured using the PPP exchange rates. If you go to the link, you can click on each of the individual bars to see what country it represents.
To have a sense of the differences in price levels across countries, and thus a sense of the size of the adjustment made by the PPP exchange rate, the ICP sets the average for world price level across countries equal to 100. From that baseline:
An index over 100 indicates prices are higher relative to the world average, while a PLI [Price Level Index] of less than 100 indicates lower prices. The most expensive economy in the world was Bermuda, with a GDP PLI of 194, followed by the Cayman Islands, Switzerland, Israel, Iceland, and Australia. The United States ranked ninth in the world with a GDP PLI of 158. High-income economies had a GDP PLI of 136 … . Upper-middle-income economies had a GDP PLI of 81 … For lower-middle-income economies, … while in low-income economies, the average GDP PLI was 50 …
It may have occurred to the reader that measuring price levels in a comparable way across all the countries of the world, in a way that adjusts for differences in quality and availability of various goods and services, is a Herculean task. There’s a reason why the estimated PPP exchange rates for 2021 are being published in 2024–it takes time to put all this together. The report describes the methodology in some detail, but there is room for skepticism. Indeed, back in 2010 Angus Deaton devoted his Presidential Address to the American Economic Association (freely available on-line here) to detailing the ”weak theoretical and empirical foundations” of such measurements. But for anyone who has read this far, it will come as no surprise that imperfect economic statistics can still be useful, when applied with context and caution.

Trending
-
1 Building a Strong Financial Foundation: Saving, Investing, and Retirement Planning
Daniel Hall -
2 Franchise Investment Pitfalls to Avoid: A Beginner's Checklist
Daniel Hall -
3 Why Selling to an iBuyer Could Be the Best Move for Your Home
Daniel Hall -
4 Financial Tips for Businesses: Reducing Expenses Without Sacrificing Quality
Daniel Hall -
5 9 Tips to Help You Secure a Graduate Job in Finance
Daniel Hall


Comments