

Analysing China's Growth and Inequality
Since 1978, China's share of world population has declined mildly from 23% to about 19%. In those same 40 yeas, China's share of world GDP has risen dramatically from 3% to about 20%. Here's China's share of world population and the global economy since the start of its economic reforms.

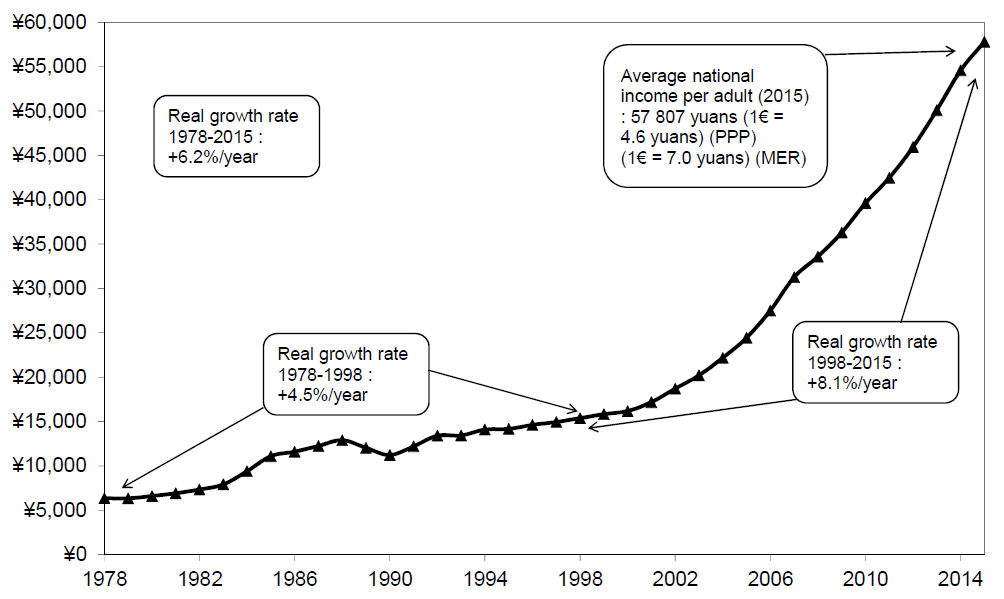
Here's a sens of this economic growth on a per adult basis. The vertical axis is in yuan, so for US readers one might want to divide by the exchange rate of roughly 6.5 yuan/dollar. But look at the annual growth rates of national income per adult--especially the average of 8.1% per year from 1998-2015.
 |
These images are taken from an article by Thomas Piketty, Li Yang and Gabriel Zucman, "Income inequality is growing fast in China and making it look more like the US: Study provides the first systematic estimates of the level and structure of China’s national wealth since the beginning of market reforms," which appears at the LSE Business Review website (April 1, 2019). It's a preview of their forthcoming research article in the American Economic Review. The main focus of their research has been to look at income and wealth inequality--and in particular, data on patterns of wealth in China has been hard to find.
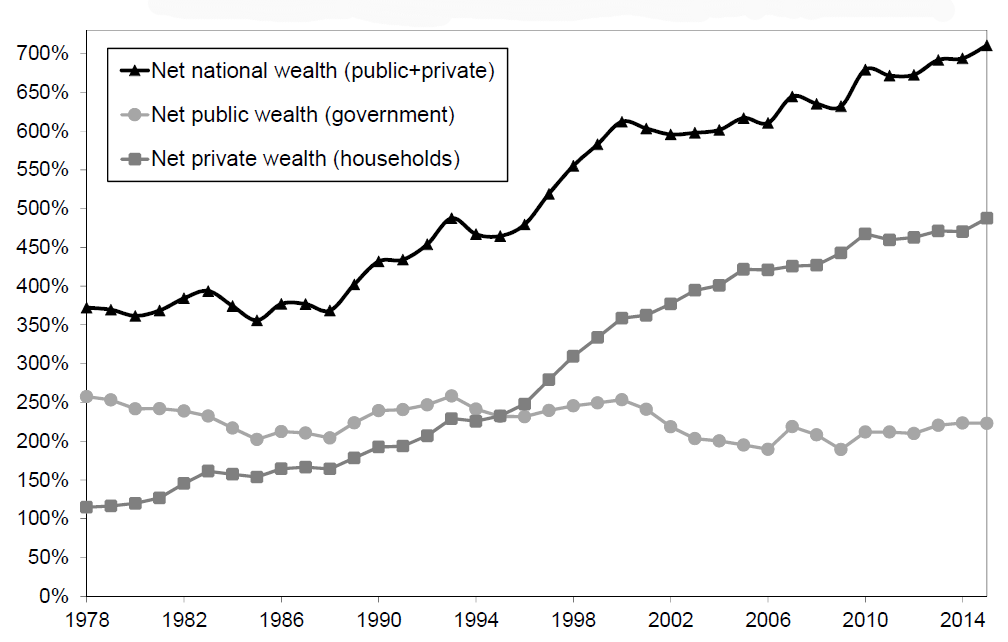
Here's the pattern of China's national wealth over time, expresses as a share of national income. Wealth includes the value of companies, the value of the housing stock, and other assets. China's wealth as a share of national income has almost doubled since 1978. And all of the increase is a result of rising wealth by households, not government.
Finally, here's a figure showing China's shift in income inequality over time. China's economic growth has meant a larger share of income for the top 10%, and a falling share for the bottom 50%.
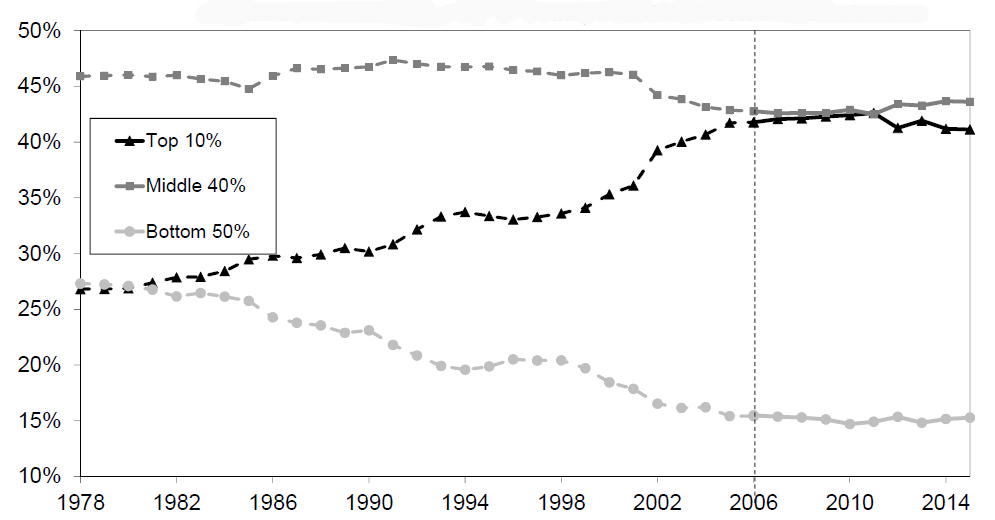
The authors write: "To summarise, the level of inequality in China in the late 1970s used to be less than the European average – closer to those observed in the most egalitarian Nordic countries – but they are now approaching a level that is almost comparable with the USA." Of course, it's important to remember that in a Chinese economy that has been growing rapidly for decades, this doesn't means that the bottom 50% have had stagnant growth in income or are actually worse off in absolute terms. It just means that the growth in incomes for the bottom half hasn't been as rapid as for the top 10%.
A version of this article first appeared on Conversable Economist.

Trending
-
1 UK Tech Sector Secures a Third of European VC Funding in 2024
Azamat Abdoullaev -
2 France’s Main Problem is Socialism, Not Elections
Daniel Lacalle -
3 Fed Chair Jerome Powell Reports 'Modest' Progress in Inflation Fight
Daniel Lacalle -
4 AI Investments Drive 47% Increase in US Venture Capital Funding
Felix Yim -
5 The Future of Work: How Significance Drives Employee Engagement
Daniel Burrus


Comments