

Global Connectness and the Pandemic
How did the pandemic affect the economic side of global connectedness?
International travel went way down in 2020, as one would expect. But other aspects of connectedness–flows of trade, capital, and especially information–held up pretty well in the first year of the pandemic. Steven A. Altman and Caroline R. Bastian tell the story with figures and short descriptions in DHL Global Connectedness Index 2021 Update: Globalization Shock and Recovery in the Covid-19 Crisis (November 2021).
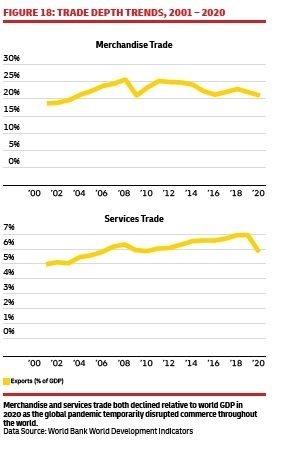
For example, here’s a pattern of merchandise and services trade around the world. Merchandise trade peaked in 2008, and the drop in 2020 was modest. The authors report that trade in goods in 2021 has now risen above pre-pandemic levels. Services trade has generally been rising, and it drops more substantially in 2020, but much of that decline is due to the fall of nearly three-quarters in international travel.
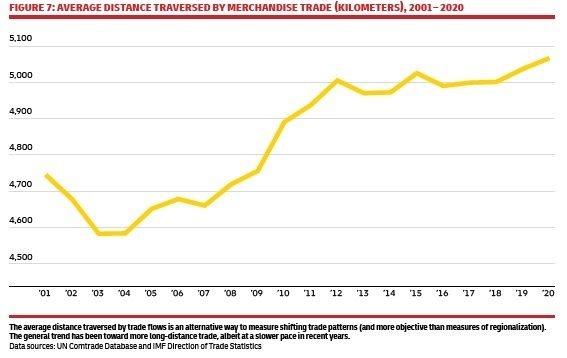
Another interesting pattern is that the distance that exports travelled has been rising over time, and kept rising in 2020. One possible interpretation here is that the pandemic had a bigger effect on limiting short-distance international trade (say, trucks crossing borders), rather than long-distance international trade (say, container ships).
In the areas of international capital flows, the authors write: “The pandemic dealt a major blow to international capital flows, but portfolio equity flows stabilized in mid-2020 and foreign direct investment began a strong rebound in 2021.”
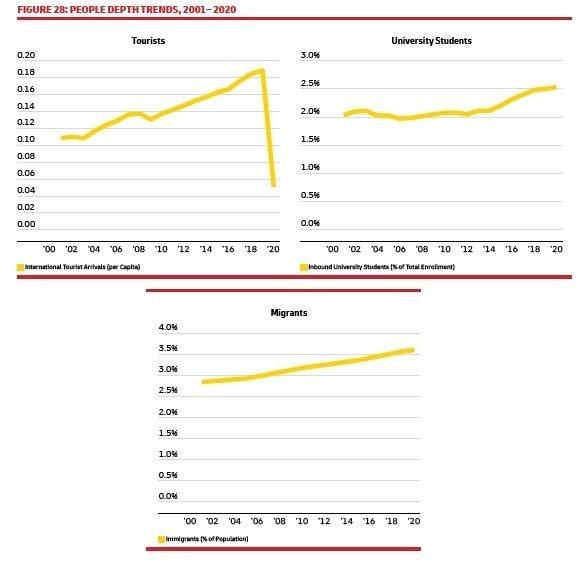
Flows of international travelers (per capita) dropped off, as shown in the first panel. However, the second panel shows that the share of students coming across borders rose in 2020, and the third panel shows that international migrants rose in 2020, too.
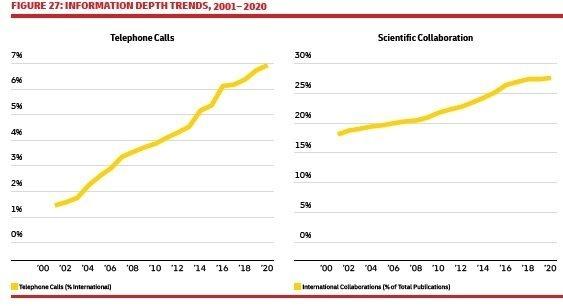
International information flows kept rising. International internet traffic had been growing about 20-25% per year before the pandemic. That growth rate spiked to almost 50% in 2020, but then has fallen back into the usual range in 2021. The left-hand figure shows that the share of all phone calls that are international keeps rising; the right-hand paper shows that the share of scientific publications co-authors by teams from different countries keeps rising, too.
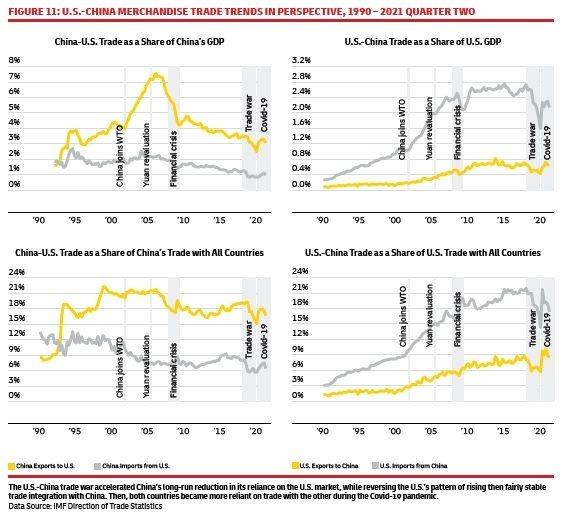
One section of the report looks at trade ties between the US and China. After the trade war that kicked off in 2018 and the pandemic, one might expect trade between the world’s two biggest economies to have fallen, but the pattern is more one of continuity than of change. For example, the left-hand panels show China-US trade as a share of China’s GDP (top) and a share of China’s trade with all countries (bottom). China’s overall exports soared in the early 2000s, after China joined the World Trade Organization in 2001 The bottom left panel shows that the share of China’s exports to the US as opposed to other countries didn’t rise much at that time–China’s exports soared everywhere. As a share of China’s GDP, exports to the US spiked in the early 2000s, but then dropped back to previous levels and have been sagging since about 2010. You can see the downward bump of the 2018 trade war in these figures, but US-China trade generally recovered back to earlier levels in 2020.
One doesn’t want to over-interpret data from any single year, of course, much less a pandemic year. But it feels as if the nature of globalization, broadly understood, is evolving from goods to services, and from finances to information flows. If someone asks about your views of globalization, it’s reasonable to being by sorting out the different categories.

Trending
-
1 UK Tech Sector Secures a Third of European VC Funding in 2024
Azamat Abdoullaev -
2 France’s Main Problem is Socialism, Not Elections
Daniel Lacalle -
3 Fed Chair Jerome Powell Reports 'Modest' Progress in Inflation Fight
Daniel Lacalle -
4 AI Investments Drive 47% Increase in US Venture Capital Funding
Felix Yim -
5 The Future of Work: How Significance Drives Employee Engagement
Daniel Burrus


Comments