

The Squeezed Middle Class: An International View
Being "middle-class" is a perception that includes more than a certain range of numerical rankings in the distribution of income. For example, it includes a sense that one's job is reasonably stable heading into the future, a sense that income from the job is sufficient to purchase the goods and services associated with middle-class social status, and a sense that this status is likely to be passed on to one's children.
Concerns over the middle class aren't just a US issue: they are coming up in high income countries all around the world. The OECD has just published "Under Pressure: The Squeezed Middle Class" (April 2019). To help focus the discussion of the size and stresses for the middle class, it defines "middle-class" as those with an income level between 75% and 200% of the median income. However, it also immediately notes that when people are surveyed about whether they perceive themselves as "middle-class," this definition captures their perceptions in only a rough way.
For example, the vertical axis of the graph below shows the share of the population in a given country that has income between 75% and 200% of the median income. The horizontal axis shows the share of people in that country who refer to themselves as "middle class." A country on the diagonal line would be one where the number who refer to themselves as "middle-class" matches the income-based definition.

Countries below the diagonal line are places where the share of those who say they are "middle-income is lower than the income-based definition. The US, for example, has about 50% of its population in the income range from 75% to 200% of the median income, but about 60% of people say they are "middle class." In Canada, about 60% of the population also says they are "middle-class," but has about 60% of Canada's population in the middle-income range. Great Britain is an interesting case where almost 60% of the population has income in the middle-income range, but only a little more than 40% of the population says they are "middle class" in survey results.
The rise in income inequality that has happened all around the world will tend to spread out the income distribution, and thus reduce the size of the middle class. But an intriguing pattern that emerges from the OECD analysis is that although the share of the population at the income level from 75% to 200% of the median varies a lot across countries (as shown in the figure above), it hasn't declined all that much over time. Their analysis across 17 high-income countries shows that 64% of the population had income from 75% to 200% of the median in the mid-1980s, and this has now fallwn to 61% of the total population--an overall decline of about 1% per decade.
But this shift in the share of population doesn't capture two more powerful trends: the share of total income received by those in this middle-income group and the prices paid for goods and services often associated with middle class status.
On the issue of the distribution of income, the OECD writes (references omitted):
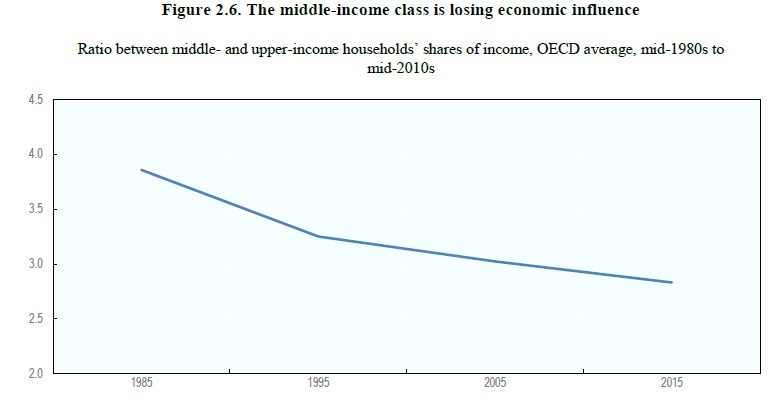
The upper-income class controls a considerably larger share of income than in the past. Between the mid-1980s and mid-2010s, its share of income increased by an average of 5 percentage points from 18% to 23%, while grew 1.5 percentage points as a share of the population (Figure 2.5, Panel B). Save in Ireland, Switzerland and France, upper-income shares of total income climbed in all countries with available data, particularly in Israel, Sweden and the United States. And, in most countries, they outstripped its expansion as a share of the population. In the United States, for example, while the upper-income class’s share of the population increased 3 percentage points from 11% to 14%, its share of all income climbed 9 percentage points – from 26% to 35%. This change in shares of income in the United States was described as a shift in the “center of gravity in the economy.”
This figure makes the point by calculating that total income for the 61-64% of the population in the 75% to 200% of median income range was four times as much as total income for the upper-income group in the mid-1980s, but that has now fallen to three times as much. Markets pay attention to buying power, and the buying power of the middle class is relatively small.
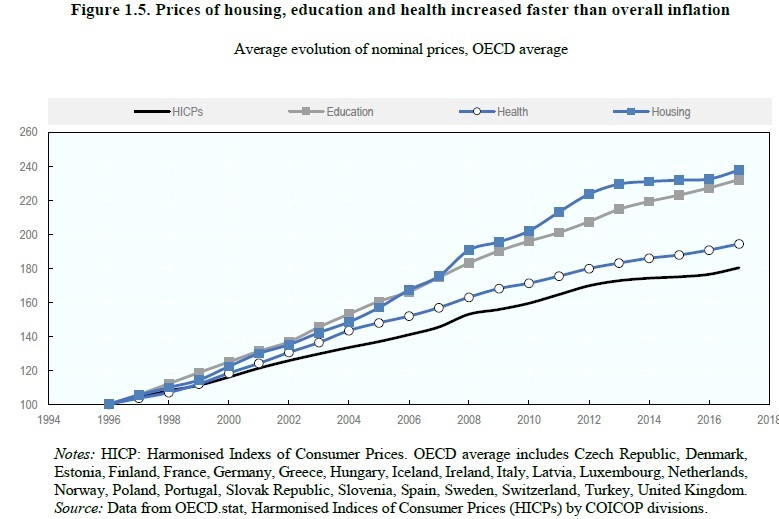
Another big shift is that the prices of certain goods typically viewed as part of a "middle-class" lifestyle have been rising faster than most prices. The black line HICP shows a measure of the overall level of inflation. The other lines show the rise in prices of education, health care, and housing. A number of the main consumption goods associated with "middle-class" status have become harder to afford.
Underlying these changes is a shift in the distribution of jobs, with a decline in middle-skill jobs in particular. The OECD writes:
Recent work by the OECD confirms that in most countries the share of jobs in middle-skill occupations has declined relative to high-skill and low-skill occupations since the mid-1990s. The OECD also finds that occupational polarisation is closely associated with changes in the distribution of occupations within sectors, although de-industrialisation (the shift of employment from manufacturing to the services) also plays an important role. Furthermore, polarisation and de-industrialisation both appear strongly related to technological change. Evidence of an association between polarisation and globalisation is weaker, however.Job polarisation has resulted in a net shift of employment to high skill occupations in most OECD countries. On average across the 21 OECD countries for which data were available, middle-skill occupations have lost 8 percentage points in employment shares, while low skill occupations have lost about 2 percentage points and the high skill occupations have gained 10 percentage points. Indeed, there was a shift towards highly skilled employment in most countries, with the aggregate share of middle-skill jobs declining in 19 countries, rising only in Mexico and the Slovak Republic. The increase in high-skill jobs offset the decline – except in Greece, Hungary and the United States. In those countries, the greatest climbs came in low-skill occupations, which nevertheless lost labour market shares in a number of other countries, though only in Belgium did they fare worse than middle-skill occupations. Overall, the most common pattern is one of a decline in middle-skill jobs relative to both high and low skill occupations, with most gains made by high-skill jobs ... Changes in the fortunes of the different skill groups may explain some of the social frustration that has been at the centre of the political debate in recent years. Jobs increasingly fail to yield the income status traditionally associated with their skill levels. In most countries, there are fewer prospects of high-skill workers being in the upper-income class, and of middle and low-skill workers in the middle-income class.
What does all of this imply about how to address concerns over the middle class? The direct concerns over the middle class involve a desire for a labor market where workers find it more straightforward to make a lasting connection with an employer, with health and pension benefits, and prospects for a career path. They involve a desire to be able to afford the consumption goods like housing, education, and health care, which in most countries are either directly run by the government or highly affected by regulation in most of these countries.
I'm not someone who is reflexively opposed to higher taxes for those with high incomes, but these kinds of concerns over the future of the middle-class are unlikely to be addressed in a sustainable and long-term way by proposals to tax the rich and subsidize the middle class. Laws that seek to command higher wages and benefits, or seek to command lower prices for certain goods, are not a long-term answer either. Actual answers involve thinking in a more detailed way about how labor markets function, and more specifically how they improve productivity while incorporating and training workers. There also needs to be more detailed thinking about the rules and practices that governments have set up around the production of housing, health care, and education, and how those rules might be sensibly reformed.
A version of this article first appeared on Conversable Economist.

Trending
-
1 UK Tech Sector Secures a Third of European VC Funding in 2024
Azamat Abdoullaev -
2 France’s Main Problem is Socialism, Not Elections
Daniel Lacalle -
3 Fed Chair Jerome Powell Reports 'Modest' Progress in Inflation Fight
Daniel Lacalle -
4 AI Investments Drive 47% Increase in US Venture Capital Funding
Felix Yim -
5 The Future of Work: How Significance Drives Employee Engagement
Daniel Burrus


Comments