Google Searches and the U.S. Presidential Election: What the Polls May Have Missed
Most of us here in the U.S. are waiting with bated breath for the results of next week’s enormously consequential presidential election.
Virtually all of the data providing insight into the likely outcome comes in the form of polling data, which, while extremely valuable, is also inherently imperfect. Selection bias arises from the fact that it is nearly impossible to get a random sample of voters with traditional polling methods, and means that polls often do not actually represent the population that they intend to capture. Polling data is also notoriously susceptible to social desirability bias — there is a strong motivation to respond with the answer perceived as being most socially acceptable, rather than the answer aligned with one’s true beliefs. Americans may report support for the Black Lives Matter movement while responding to a poll, for example, even while harboring racist views that lead them to vote for Donald Trump.
In 2016, polls generally underestimated Trump’s performance by 2 full percentage points. However, an unexpected data source — Google searches — was able to identify geographic areas where Trump would perform better than the polls predicted. While Google searches are subject to some selection bias (individuals without access to Google or who infrequently make Google searches will be underrepresented), this bias is generally problematic to a lesser extent than in polling data. Additionally, the issue of social desirability bias is largely removed — instead of answering an individual’s questions, searches are made in the privacy of the Google search bar. A randomized sample of all Google searches can be obtained publicly through the Google Trends website, where users are able to request data by specific search queries and topics, geographic regions, and timeframes. Data are rescaled from 0 to 100 in the form of a relative proportion, with 100 representing the date or geographic region in which searches for the query of interest constituted the greatest proportion of all Google searches.
Seth Stephens-Davidowitz, author of the bestselling book Everybody Lies, has largely pioneered the approach of using Google Trends data to predict election results. Stephens-Davidowitz has shown that higher rates of racist Google searches partially explained both where Obama would do worse than predicted in 2012 and where Trump would do far better than predicted in 2016. He has also found that when individuals make searches containing both candidates’ names, such as “Trump Clinton debate” or “Clinton Trump debate,” they tend to subconsciously place the name of the candidate they will vote for first. In areas where “Trump Clinton” searches were more common than “Clinton Trump,” Trump tended to do better than Hillary Clinton in 2016. Stephens-Davidowitz has also been able to address another major shortcoming of polls:
“More than half of citizens who don’t vote tell surveys immediately before an election that they intent to, skewing our estimate of turnout, whereas Google searches for ‘how to vote’ or ‘where to vote’ weeks before an election can accurately predict which parts of the country are going to have a big showing at the polls (Everybody Lies, p. 9)”
While polling data remains an incredibly valuable resource, Stephens-Davidowitz has clearly shown that Google Search data can serve as a useful supplementary data source in predicting election outcomes. I will implement his techniques below to see what Google Search data has to say about the November 3rd Biden-Trump election.
Analysis*
* It is worth noting that Stephens-Davidowitz retroactively utilized data representing searches made throughout the entire month of October in his analyses, while I am only using data from the first three weeks in order to complete this analysis before the election. In a follow-up post I will incorporate search data from the full month of October and see how well this search data correlates with voter turnout and election results.
Several sources (including the New York Times and 538) have identified Arizona, Florida, Michigan, North Carolina, Pennsylvania, and Wisconsin, all of which were won by Trump in 2016, as being the swing states to watch in this election. These states will be the focus of my analysis.
For comparison purposes, I am including the latest polling data (obtained from CNN) as of October 25, 2020 for these swing states below:

Now let’s see what Google Trends has to say.
Searches for Biden Trump vs Trump Biden
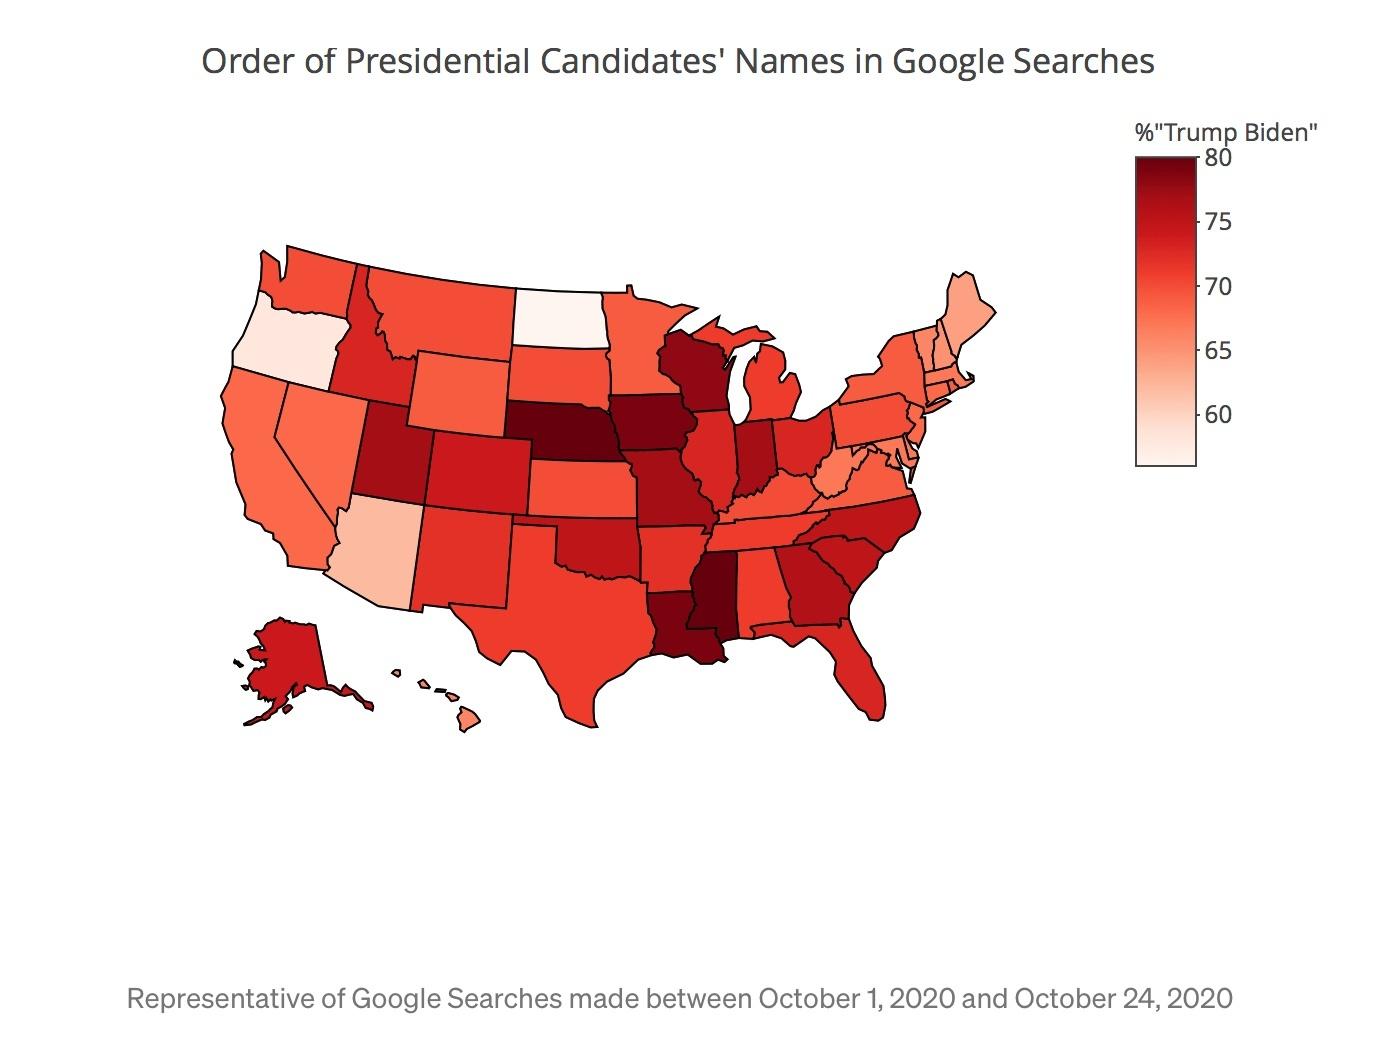
Stephens-Davidowitz found in 2016 that Trump is a unique candidate. The normal rules of candidate name order in Google searches broke down — instead, just about every state, including consistently left-leaning states, had “Trump” first in more searches that contained both candidates’ names. However, states where “Trump Clinton” was much more common than “Clinton Trump” seemed to be states where Trump was performing better than expected. The same holds true now, at least in terms of Trump being an unusual candidate. As you’ll see below, every single state has more “Trump Biden” searches than “Biden Trump” searches.

I’ve pulled out values for our swing states in the following table:

North Carolina is the swing state where polling data is most favorable to President Trump and is unsurprisingly also the swing state with the second-greatest percentage of searches where “Trump” is placed before “Biden.”
Interestingly, Wisconsin - the swing state tied for the lowest polling support of President Trump at 43% - is the swing state with the greatest percentage of searches placing Trump’s name first (78%). These data suggest that Trump may perform somewhat better in Wisconsin that the polling data predicts, although the currently raging COVID-19 outbreak in Wisconsin may add an interesting layer of complexity to this relationship.
Also of note is Arizona, which is an outlier among the swing states with “Trump” coming first in only 62% of searches containing both candidates’ names. While the polling data from Arizona indicates a very close race, Biden might be doing somewhat better in this state than the polls have captured.
Searches for “Vote” and “Voting”
As described above, Google searches for “vote” and “voting” have been shown to predict voter turn-out. However, it’s impossible to know yet how all of the changes brought about by the pandemic may impact this relationship. Far more people than ever before are deciding how to vote safely, requesting absentee ballots, and questioning whether or not their votes will even count. Additionally, the intensity of voter registration and information campaigns this election cycle may mean that fewer Americans need to use Google in order to find voting information.
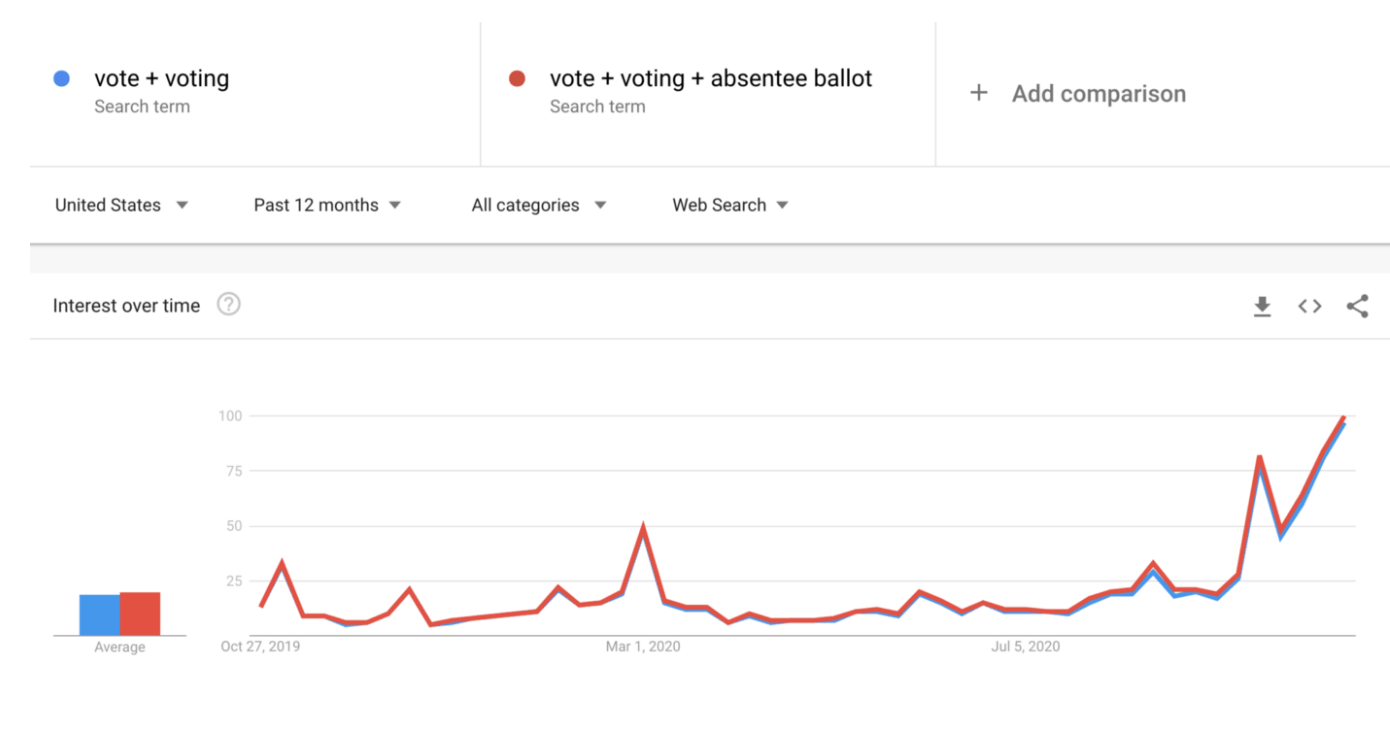
Given these changes, I tried including search volume for “absentee ballot” in my analysis in addition to “vote” and “voting,” but the associated increase in search volume was so minimal that I reverted back to only including Stephens-Davidowitz’s original two queries:

Once voter turn-out data becomes available after the election, it will be possible to see how the relationship between these search queries has changed since the last election cycle. It will additionally become possible to see if search queries that weren’t meaningful predictors in 2016 became important predictors of 2020 voter turnout. Based upon the currently available data, however, I will only be using these two queries in the following analysis.
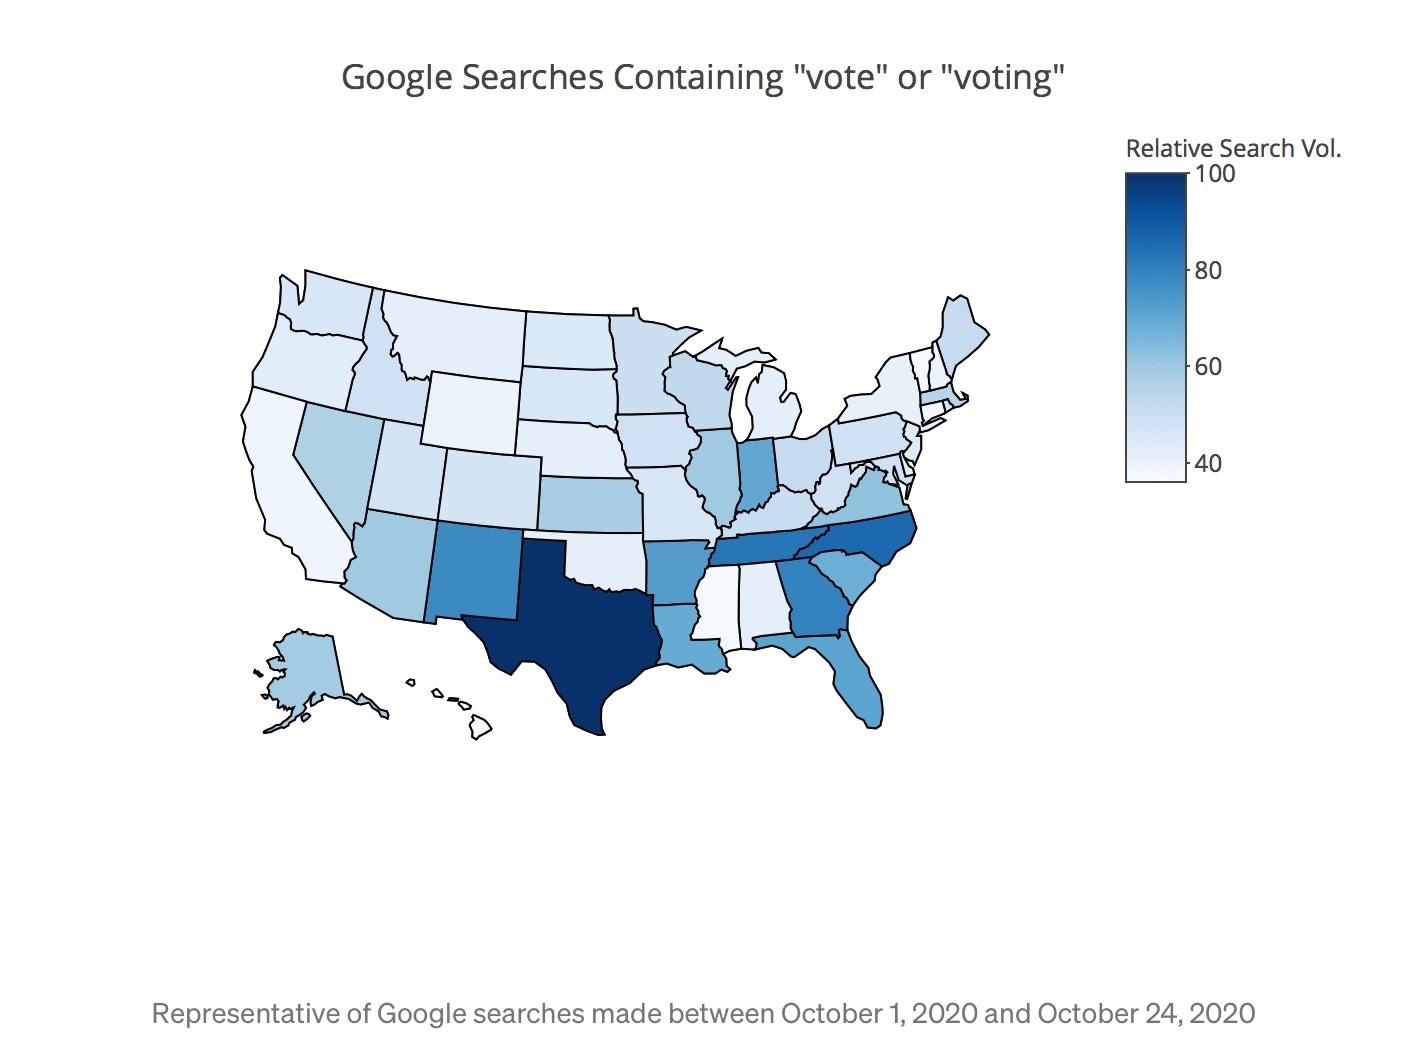
First, let’s look at state-level relative search volume for Google searches containing “vote” or “voting”:

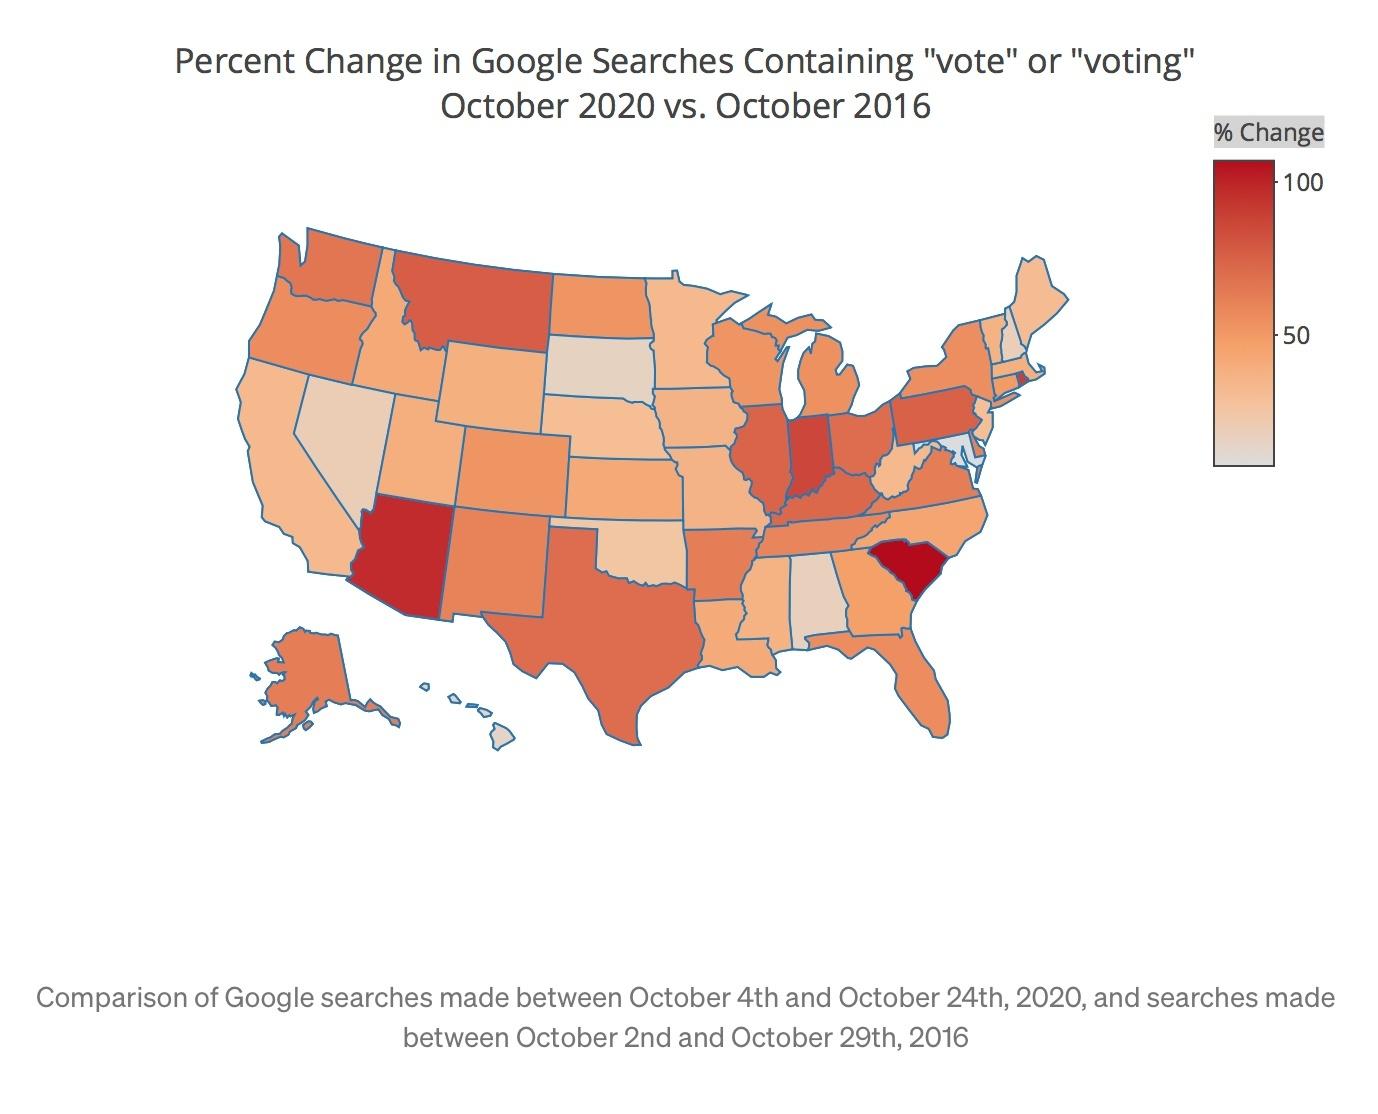
Let’s also look at the percent change in relative Google search volume for “vote” and “voting” searches between October of 2020 and October of 2016:

Again, I have pulled out values from the maps above for the six swing states:

There are several interesting things going on here.
First of all, I was immediately struck by the fact that relative search volume for “vote” or “voting” has increased in all 50 states since 2016, even though a somewhat smaller range of dates was used to represent 2020 searches (a result of Google Trends only providing weekly data for time periods of this length). This could be due to the additional research being done by Americans to figure out a plan to vote during a pandemic, or possibly just because of the unusually divisive nature of this election. Either way, it was encouraging to see this level of voter engagement.
Arizona also stands out again, this time due to the 94% increase in relative search volume for “vote” or “voting” that occurred between 2016 and 2020. Arizona has previously been ranked 43rd out of the 50 states in voter turnout, and this low turnout is believed to disproportionately affect younger, poorer, and minority voters. While these Google data cannot tell us who is making searches about voting, it stands to reason that an increase in overall voter turnout would be associated in at least a moderate increase in turnout among these groups of voters. As younger, poorer, and minority voters all tend to lean left, an increase in voter turnout in Arizona might be more likely to benefit the Democratic Party (which is also consistent with the lower percentage of searches containing both candidates’ names in Arizona where “Trump” came first).
Although Pennsylvania’s voting-related search volume is low compared to other states (relative proportion of 49), Pennsylvania has shown a substantial increase (72%) in searches containing “vote” or “voting.” Again, we cannot know with any certainty who might be represented by an increase in voter turnout. However, voter turnout among Black voters was particularly low in the 2016 election, and an increase in Black voter turnout would be likely to help the Democratic Party. However, Pennsylvania also ranks 9th out of the 50 states in terms of the highest racist Google search volume. These racist searches were predictive of increased Trump support in Pennsylvania in the 2016 election, and indicate that the impact of increased turnout in this state will depend heavily upon who these additional voters are.
Conclusion
There are few elections for which Google search data is available, and the 2020 presidential election is unprecedented given the pandemic and the countless ways that Trump’s first four years in office differed from any other U.S. presidency in history. It is therefore impossible to make any definitive claims based upon this analysis, but it is unlikely that the polls are perfectly representative of the results we’ll see on Election Day. Google search data indicates that Biden may do better than predicted in Arizona, that Trump may do better than predicted in Wisconsin, and that Pennsylvania may see a meaningful increase in voter turnout which could benefit either candidate. While the polls may indicate a clear Biden victory, Democrats cannot afford to be complacent.
Trending
-
1 76 Theses on American Patriotism
Timothy Taylor -
2 A Comprehensive Approach to Handling Riots
Bhumesh Verma -
3 Innovative Approaches to Diplomacy: A Multi-Pronged Strategy for The Phygital Era
Dr. Ingrid Vasiliu-Feltes -
4 Business Chiefs Gather to Discuss India Trade Deal Proposals
Nitish Mathur -
5 Everything You Need to Know About Jordan Bardella
Felix Yim


Comments